

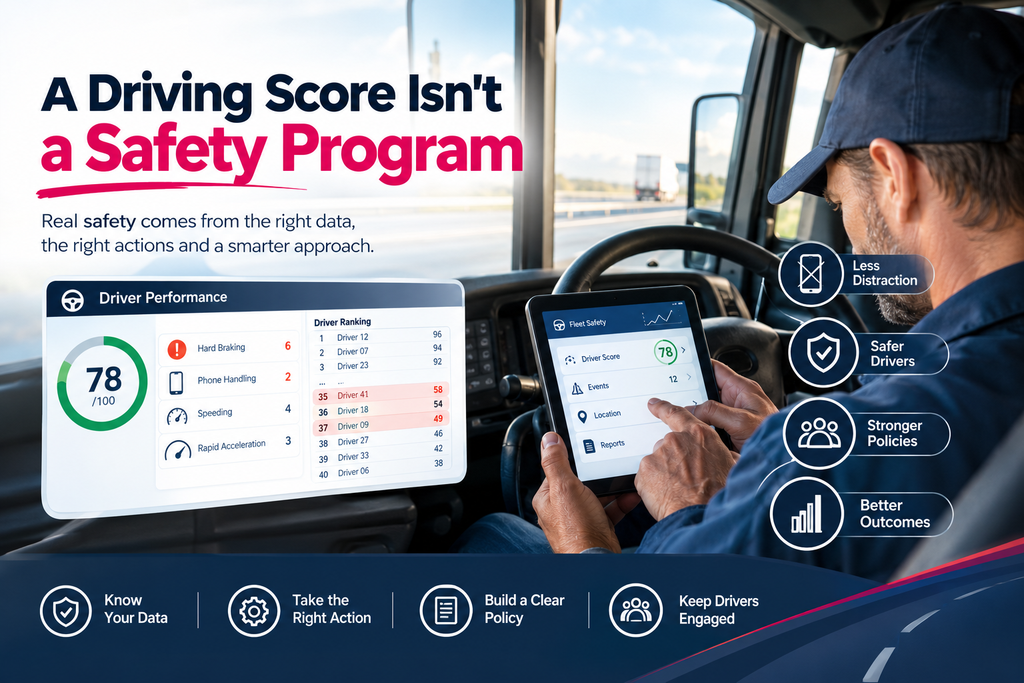
A fleet manager opens a new telematics dashboard and finds forty drivers ranked from best to worst. Six are flagged for hard braking. Two show frequent phone handling. The data is specific and, for many fleets, brand new. What to do with it is less obvious.
That question sits at the center of driver risk management. Measuring how people drive has become routine for fleets and, through usage-based insurance, for many personal drivers too. Reducing the risk those numbers describe takes more than a dashboard, and the research on what works is more nuanced than marketing tends to suggest.
What driver data actually captures
Telematics tracks driving through a device installed in the vehicle or through a smartphone. According to the National Association of Insurance Commissioners (NAIC), those tools can measure miles driven, time of day, location, rapid acceleration, hard braking, hard cornering, cell phone use, and airbag deployment.
How the information gets used varies. NAIC says that, depending on the insurer and what the state allows, the data can help determine premiums. A usage-based insurance (UBI) program adds individual driving behavior as one more rating factor next to traditional ones such as driving record and vehicle type. NAIC also cautions that UBI can lead to higher premiums, that not every driver will qualify for a discount, and that insurers are still developing how they use the raw data. Fleets often use the same kind of data without an insurer involved, for coaching, incident review, and route planning. Scoring is not standardized, so a “good score” means different things in different programs, and pricing practices differ by insurer and state.
Why measuring is not the same as reducing
The clearest evidence on this comes from an FMCSA-funded evaluation by the Virginia Tech Transportation Institute. Truck drivers at two carriers used vehicles fitted with an onboard safety monitoring device for 17 weeks. During the first four, the device recorded events, but managers could not see them and drivers got no feedback. Then the feedback light was switched on and safety managers followed a coaching protocol. Recorded events per mile dropped 37% at one carrier and 52.2% at the other. The researchers credited the combination of monitoring and coaching. The study was small, more than 15 years old, and covered one commercial system, so it points a direction rather than promising a result.
A more recent randomized trial, published in Accident Analysis & Prevention, tested simulated UBI programs over 12 weeks with weekly feedback and up to $100 in rewards. Speeding fell by up to 13%, and hard braking and rapid acceleration by up to 25%. Drivers kept the improved habits after incentives ended.
One result stands out for anyone worried about distraction: phone use did not improve measurably. The researchers suspect the app’s default scoring was too generous. The average participant was graded an “A” for phone use while handling the phone about 6% of the time. If a score says things are fine, drivers work on something else.
Turning data into action
For fleets, the practical translation is a short, repeatable loop. Pick the few behaviors that matter most for your operation, such as phone handling, hard braking, or following distance, rather than tracking everything at once. Review flagged events on a regular schedule instead of letting them pile up. Talk with the driver while the event details are fresh, and note what changed afterward. Pair all of it with a written phone policy so the data is measured against a clear standard.
The same logic applies to insurance driver monitoring. The feedback loop matters as much as the sensor, and what a driver or fleet gets out of a program, including any effect on premiums, still depends on the insurer, the program design, and the state. Driver distraction monitoring in particular is only as useful as the definition behind it: if the threshold for “risky” is set too loosely, the score reassures without changing anything.
Distraction is one risk among several
The scale of the problem is worth stating carefully. NHTSA reports that 3,208 people died in 2024 in crashes involving distracted drivers, about 8% of traffic deaths, and that police reports cited cellphone activity in 14% of distraction-affected fatal crashes. NHTSA also notes that distraction is probably undercounted because it depends on police reports and driver admissions.
Alcohol impairment is a separate risk with a different profile. NHTSA counted 11,904 deaths in alcohol-impaired-driving crashes in 2024, roughly 30% of all traffic fatalities. Distraction shows up in behavior data and responds to policy and coaching. Impairment can be checked before a trip begins.
That difference is the practical point. A sound driver risk management program maps each major risk to a control, whether that is a written policy, monitoring, coaching, or a barrier that acts before the trip starts, instead of assuming one dashboard covers everything. This overview of reducing distracted driving risk looks at the same question from the insurance side: what gets detected, and what actually gets prevented.
Privacy and transparency
Driving data is personal data, and location history is especially revealing. NAIC lists privacy concerns among the drawbacks of UBI. Employers face the same issue with company drivers.
A sensible starting point is telling drivers, in plain language, what is collected, why, who can see it, and how long it is kept. Data collected for safety should be used for safety, not surprise discipline. Legal requirements differ: some states, including New York and Connecticut, require written notice before certain kinds of employee electronic monitoring, and details vary by state and by the type of data. This is general information, not legal advice, so employment counsel should review any monitoring program.
Questions to ask before adopting any tool
Safe driving technology covers a wide range, from after-the-fact scoring to controls that act before a trip begins, such as in-vehicle alcohol detection tied to ignition protection. Whatever the category, five questions help:
- What does it measure, and how is the score set? Check default thresholds, as the phone-use finding shows.
- What happens after an event? Someone has to review it, and someone has to talk to the driver.
- Does it act before or during a trip, or only report afterward?
- What does it not see? No single tool covers distraction, impairment, fatigue, and speed.
- How are drivers informed, and how is the data protected?
Frequently asked questions
What is driver risk management?
It is the process of identifying how drivers create risk, choosing controls such as policies, training, monitoring, and technology, and checking whether those controls work.
Does telematics lower insurance premiums?
Not automatically. NAIC notes that UBI can raise premiums as well as lower them, and outcomes depend on the insurer, the program, and the state.
What is usage-based insurance?
It is auto insurance that uses individual driving behavior, such as mileage, braking, and acceleration, as an additional rating factor. Variants include pay-as-you-drive and pay-how-you-drive.
Does monitoring reduce risky driving on its own?
The evidence points to feedback as the key ingredient. In the FMCSA-funded study, event rates fell after coaching began, not during the baseline weeks when drivers received no feedback.
Conclusion
Telematics has made driving behavior visible, but visibility is only the first step. The research suggests feedback and coaching are what move behavior, that scoring choices shape what drivers focus on, and that distraction and impairment call for different controls. Tools such as My Drive Guardian, which pairs in-vehicle alcohol detection and ignition protection with location and driving reports, address one part of that picture; it does not monitor phone activity. The rest still depends on policy, coaching, and clear communication with drivers.
