

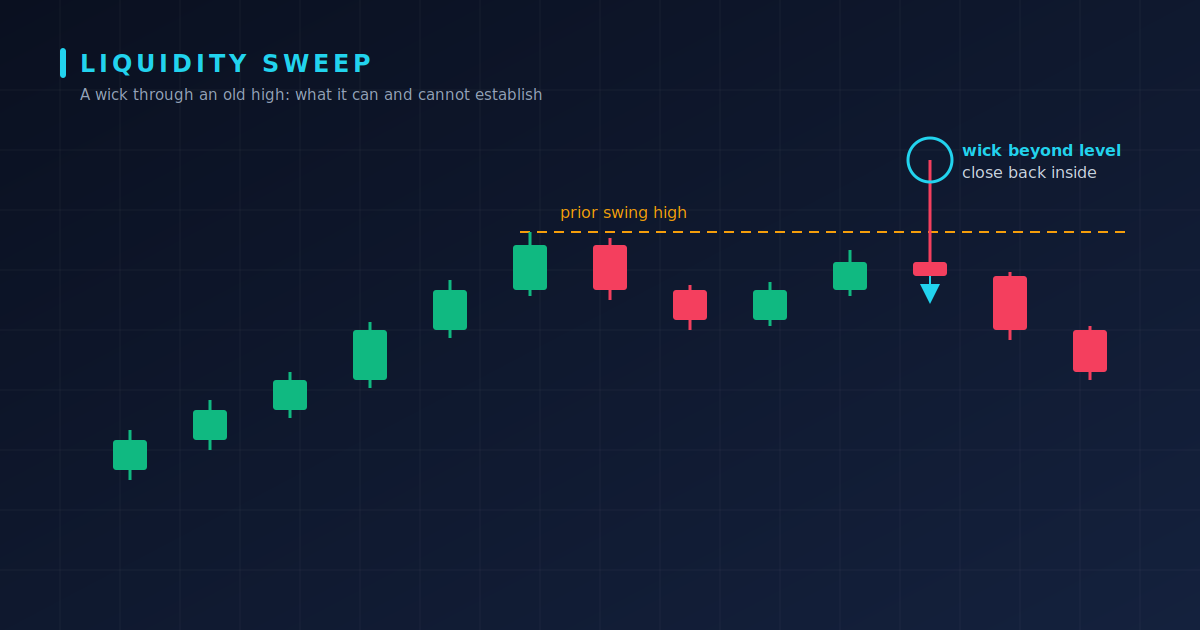
A candle spikes above an obvious high, trades there for a moment, then closes back underneath. Chart communities often call this a liquidity sweep. The label is convenient, but it describes a hypothesis about why price moved, not a fact the candle can prove.
So, what is a liquidity sweep in trading? In chart terms, it is a brief move beyond a previously visible swing high or low that quickly returns to the prior range. The idea is that resting orders, such as stop orders, cluster near obvious levels, and price may trade through that area. A liquidity sweep is useful as a research label only when you can state, before looking at the outcome, what counts as one. This guide shows how to spot a liquidity sweep with a repeatable rule, and where the claim has to stop.
All prices below are hypothetical and chosen only to illustrate the process. They are not trade signals.
Define the Reference Swing Before Inspecting the Outcome
The most common error is choosing the level after seeing the reaction. If you draw the line once you know where price turned, almost every chart will appear to contain a sweep.
Write the definition first. A simple, testable version looks like this:
- Chart: BTC/USDT, 1-hour candles, one named exchange.
- Swing high: a candle whose high is above the highs of the five candles before it and the five after it.
- Record: the level, the timestamp, and the exchange, saved before the next session begins.
Suppose the swing high is 100,000, recorded on Monday. On Tuesday a candle prints a high of 100,350 and closes at 99,820. Under the rule written in advance, the high exceeded the level by 0.35% and the close finished back below it. That makes the candle a sweep candidate, nothing more.
Two details matter here. First, candle highs differ between exchanges, so a level taken from one venue may not exist on another. Second, the rule has to stay fixed. If you later change the swing definition from five candles to three because it fits better, you have started a new test.
Traders who use smart money concepts in crypto often describe these levels with their own vocabulary, but definitions vary between educators. Use whichever terms you prefer, as long as you write down a rule that a second analyst could apply and get the same result.
Compare a Sweep Candidate With a Sustained Break
The same wick can belong to two very different stories. Decide in advance what separates them.
| Observation | Sweep candidate | Sustained break |
| Close relative to the level | Back below the level within a set window (for example, 3 candles) | One or more closes above the level beyond that window |
| Behavior of the old high | Acts as resistance again | Acts as support on a retest |
| Status when the wick forms | Unconfirmed until the window ends | Unconfirmed until the retest holds or fails |
Now consider a counterexample. Use the same level, 100,000, and the same wick to 100,350. This time the candle closes at 100,280, the next candle closes at 100,500, and a later pullback holds at 100,000. By the pre-set rule, this is a sustained break, even though the first candle looked identical to the first example for the first few minutes.
The lesson is timing. At the moment the wick forms, you cannot know which outcome is coming. The word “sweep” can only be applied after the window closes, and any decision made earlier rests on a guess. For a deeper walkthrough on how to identify a candidate and test the interpretation, read this guide to liquidity sweeps in crypto.
Record Failed Interpretations Without Redrawing the Level
A research log is more valuable than a gallery of clean examples. For each candidate, record the level and timestamp, the window rule, the outcome (sweep, sustained break, or unresolved), and a short note on why it failed if it did.
Resist moving the line. If price reverses 40 points below where you drew it, the temptation is to shift the level so the story fits. Don’t. Leave the original marking, note the miss, and count it. After 20 candidates you may find that sweeps and sustained breaks occur at similar rates, which is a useful finding in its own right.
Be equally disciplined about the claim you make. A wick through an old high can establish that price traded beyond the level and closed back inside the range within your window. It cannot establish who traded, whether stop orders were actually triggered, or that anyone intended to “hunt” them. Public candles do not show hidden order intent, so any such language should be treated as a hypothesis, not a conclusion.
Frequently Asked Questions
Can a candle identify the participants behind the move? No. A candle shows price, volume, and time. It does not reveal who placed the orders or why.
Is every brief break a liquidity sweep? No. A brief break qualifies only if it meets the rule you set in advance. Otherwise it may be a sustained break, a news-driven move, or ordinary noise.
What evidence would invalidate the interpretation? Closes beyond the level after your window ends, a retest where the old high holds as support, or a log in which candidates fail at least as often as they succeed.
Conclusion
A liquidity sweep is a useful way to describe a certain chart pattern, but only when the definition is fixed before the outcome is known. Define the swing first, separate sweep candidates from sustained breaks, and keep a log that includes the failures. Then you will know what your wick examples actually show, and what they cannot.
