

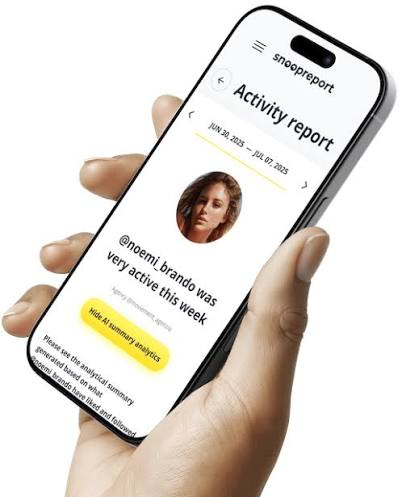
Snoopreport is a long-running tool for tracking public Instagram activity. It launched in 2017, has been used by more than 500,000 people and has kept working through several rounds of Instagram changes, including the removal of the Following tab. In this review we look at it from a technical angle: what data it works with, how reports are structured, what the AI Summary actually does and where its limits are.
If your main goal is to see what someone likes on Instagram, this review should tell you whether Snoopreport is the right fit.
Data Model: What Snoopreport Works With
Snoopreport builds reports from public Instagram activity. That design choice drives everything else:
- Public profiles only. If an account is private, its activity isn’t visible to the public and isn’t available to Snoopreport.
- No account connection. The service doesn’t log in as you and doesn’t need access to your Instagram account at all.
- Time-series by design. Activity is collected into reports over time, so history is a core feature rather than an add-on.
Because your account isn’t involved, nothing about your tracking is visible to the tracked profile, and there’s no risk of Instagram flagging your account for automated behavior.
Report Structure
Each report is organized into sections, delivered weekly or monthly depending on your plan:
Likes
Posts and reels the profile liked during the period, with the accounts that published them. This is the section people come for when they want to see what someone likes on Instagram.
Follows and unfollows
Accounts added to and removed from the following list, with dates. Combined with likes, this shows whether a new follow turned into active engagement.
Activity times
When the profile tends to be most active on Instagram, useful for spotting routines and for timing outreach.
AI Summary
A natural-language synthesis of the profile’s interests, habits and notable patterns, generated from the likes and follows in the report.
The AI Summary, in Detail
The AI Summary is Snoopreport’s main differentiator. Raw likes data is noisy: a profile might like a hundred posts a week across memes, friends’ photos, brand ads and niche hobbies. The summary groups that activity into themes, highlights what’s consistent and what’s new, and describes it in plain language.
In practice, it produces outputs like a profile’s main interest areas, recurring creators and brands, signs of new hobbies and practical suggestions such as gift ideas or conversation starters. It turns a dataset into something you can act on in a couple of minutes.
Why are likes such a good input? Instagram itself treats them as a strong signal. In an explainer on how ranking works, Instagram’s head Adam Mosseri listed a person’s activity, including the posts they’ve liked, among the signals that shape what they see in Feed and Explore. Snoopreport applies a similar idea in reverse: if likes predict what someone wants to see, they also describe what someone is into.
How the Reports Evolve Over Time
The first report on a new profile is a snapshot: recent likes, current follows and an initial summary. Value compounds from there. By the fourth weekly report, the AI Summary can distinguish stable interests from new ones, and the follows section shows a clear timeline of additions and removals. After a few months, you can compare seasons, for example how a profile’s attention shifted from travel content in summer to home and cooking content in winter.
This is also why Snoopreport favors weekly and monthly reports over a constant stream of notifications. Patterns need time to form, and a report format makes them far easier to see than a feed of individual events.
How It Compares to Alternatives
Manual checking can confirm whether someone liked a specific post, but it can’t reveal likes on posts you didn’t think to check. Mobile apps focused on alerts are convenient for quick pings but usually stop at raw lists. Login-based viewers may show more about your own account, at the cost of handing over your credentials. Snoopreport’s combination of public-only data, history and AI analysis puts it in a different category: less about instant alerts, more about understanding.
Platforms and Access
- Web dashboard: works in any modern browser with no installation.
- iOS app: for reading reports on the go.
- Sample report: available on the website to preview the format.
- Research access: Snoopreport offers free datasets to data science students and researchers on request.
Pricing
Plans start at $0.99 a week. For a tool that combines likes, follows, unfollows, history and AI analysis, that’s an accessible price, and it removes most of the risk of trying it.
There’s no free trial needed to judge the format: the public sample report shows a complete report layout, including the likes section and the AI Summary, so you know exactly what you’re buying before you add a profile.
Strengths and Limitations
Strengths:
- Likes, follows and unfollows in one consistent report
- History built in from day one
- AI Summary that turns noisy activity into clear themes
- No login and no connection to your account
- Long track record and low starting price
Limitations:
- Public profiles only, as with every legitimate tool
- Weekly or monthly reports rather than real-time streams
- Likes are signals, not certainties; interpretation still needs common sense
Security Considerations
From a security standpoint, the no-login architecture is the most important feature. Many Instagram viewers authenticate as the user, which gives them full account access and creates a single point of failure. Snoopreport’s approach removes that entire class of risk: there are no credentials to steal, no tokens to leak and no automated actions performed through your profile.
Use Cases
- Personal: understanding a friend’s interests for gifts or conversation.
- Fandom: following what favorite creators and public figures engage with.
- Marketing: influencer vetting, competitor research and audience analysis.
- Research: studying public engagement patterns over time.
- Parenting: insight into a teen’s public account activity as a starting point for conversation.
FAQ
How accurate is the likes data?
- Reports are built from public activity collected over time. As with any tracker, the value lies in consistent patterns across weeks rather than in any single data point.
Can the tracked person see that I’m using Snoopreport?
- No. Your account isn’t connected, and Snoopreport doesn’t interact with the tracked profile.
Does Snoopreport work for business accounts?
- Yes. Any public profile can be tracked, including brands and creators, which makes it useful for competitor and influencer research.
Is there an API or data export?
- Snoopreport focuses on reports in its web dashboard and iOS app. For academic work, it offers free datasets to data science students and researchers on request.
How long does the first report take?
- Reports are delivered on a weekly or monthly schedule, and history builds from the day you add a profile. The sample report shows the format in the meantime.
Verdict
Technically, Snoopreport gets the fundamentals right: public data only, no account connection, history by design and an AI layer that makes likes data readable. If you want to see what someone likes on Instagram and understand what it means, it’s a strong and affordable option, from $0.99 a week. Try the sample report and add a profile at snoopreport.com.
